
What it actually reports
The changelog entry, from cloudflare/workers-sdk’s packages/wrangler/CHANGELOG.md, wrangler@4.116.0 (released 2026-07-30):
“Graduate
wrangler check startupfrom alpha and show bundle size”
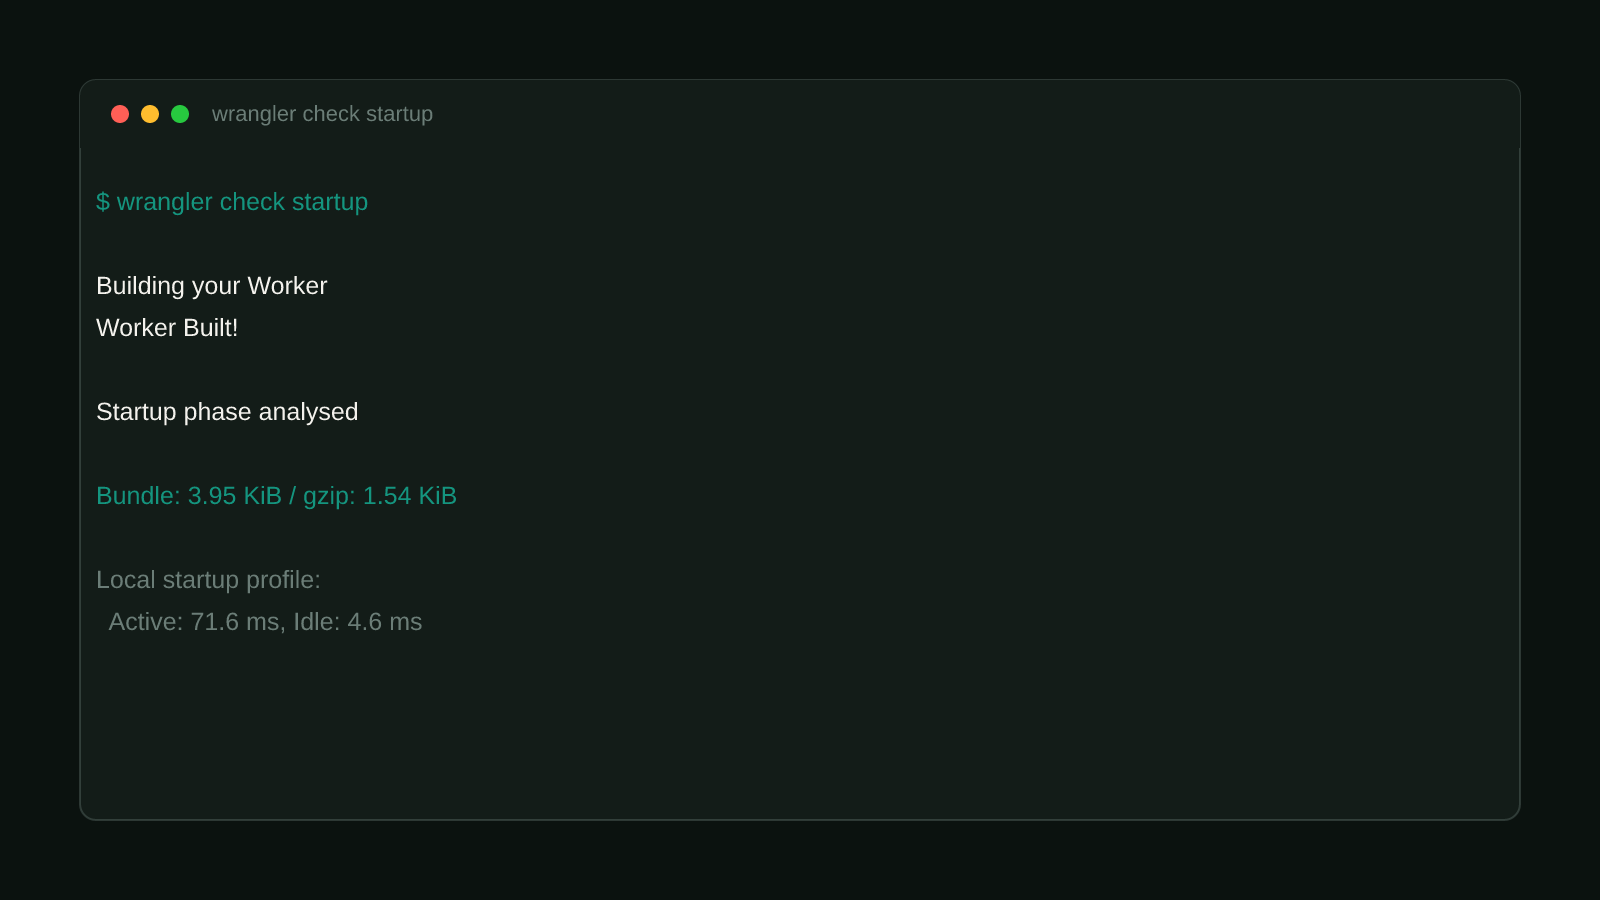
Run directly against this site’s own built Worker:
$ wrangler check startup

 ⛅️ wrangler 4.118.0
────────────────────
├ Building your Worker
│ Worker Built! 🎉
│
├ Analysing
│ Startup phase analysed
│
│ Bundle: 3.95 KiB / gzip: 1.54 KiB
│
│ Local startup profile:
│   Profile window: 153.0 ms
│   Sampled time: 76.2 ms
│   Active: 71.6 ms (including 0.0 ms garbage collection)
│   Idle: 4.6 ms
│   Samples: 3
│
│ CPU Profile has been written to worker-startup.cpuprofile.
Two real numbers come out of this: the actual bundle size (gzip and raw), and a sampled CPU profile of the Worker’s startup phase, written to a .cpuprofile file that loads directly into Chrome DevTools’ profiler or VS Code for a flamegraph view.
Local timing is not production timing
Wrangler’s own output is direct about this: the CPU profile runs on your local machine, which has a different CPU than Cloudflare’s runtime. Use it to see where time is spent during startup, not to predict the exact cold-start number a real deploy will show.
Structural Comparison Matrix
| Operational Aspect | Before (alpha, pre-4.116.0) | After (v4.116.0+) |
|---|---|---|
| Command availability | Behind alpha gating | Generally available |
| Bundle size reported | Not shown | Raw and gzip size, in the same output |
| How you’d catch bloat before this | Only after a deploy, via dashboard or cold-start complaints | Locally, before deploying at all |
Fix it: add this to your pre-deploy routine
npm run build
wrangler check startup
The .cpuprofile file it writes isn’t meant to be committed. It’s a local diagnostic artifact, so add it to .gitignore if your project doesn’t already ignore Wrangler’s build output:
worker-startup.cpuprofileConfirmed version
Reproduced directly against this site’s own build, wrangler@4.118.0, tracing back to the labeled graduation in wrangler@4.116.0 (released 2026-07-30). The bundle size and profile numbers above are this site’s real Worker, not illustrative figures. Browse more posts like this in the Dev Tools archive.