
Three blind spots GitHub just closed
Before mid-2026, nobody using GitHub Copilot could see their real AI Credits consumption anywhere in the product. Not the seat holder burning through them, not the org owner managing the budget, not the enterprise admin rolling it up across teams. The number existed somewhere on GitHub’s billing backend, but the product gave you no live view of it.
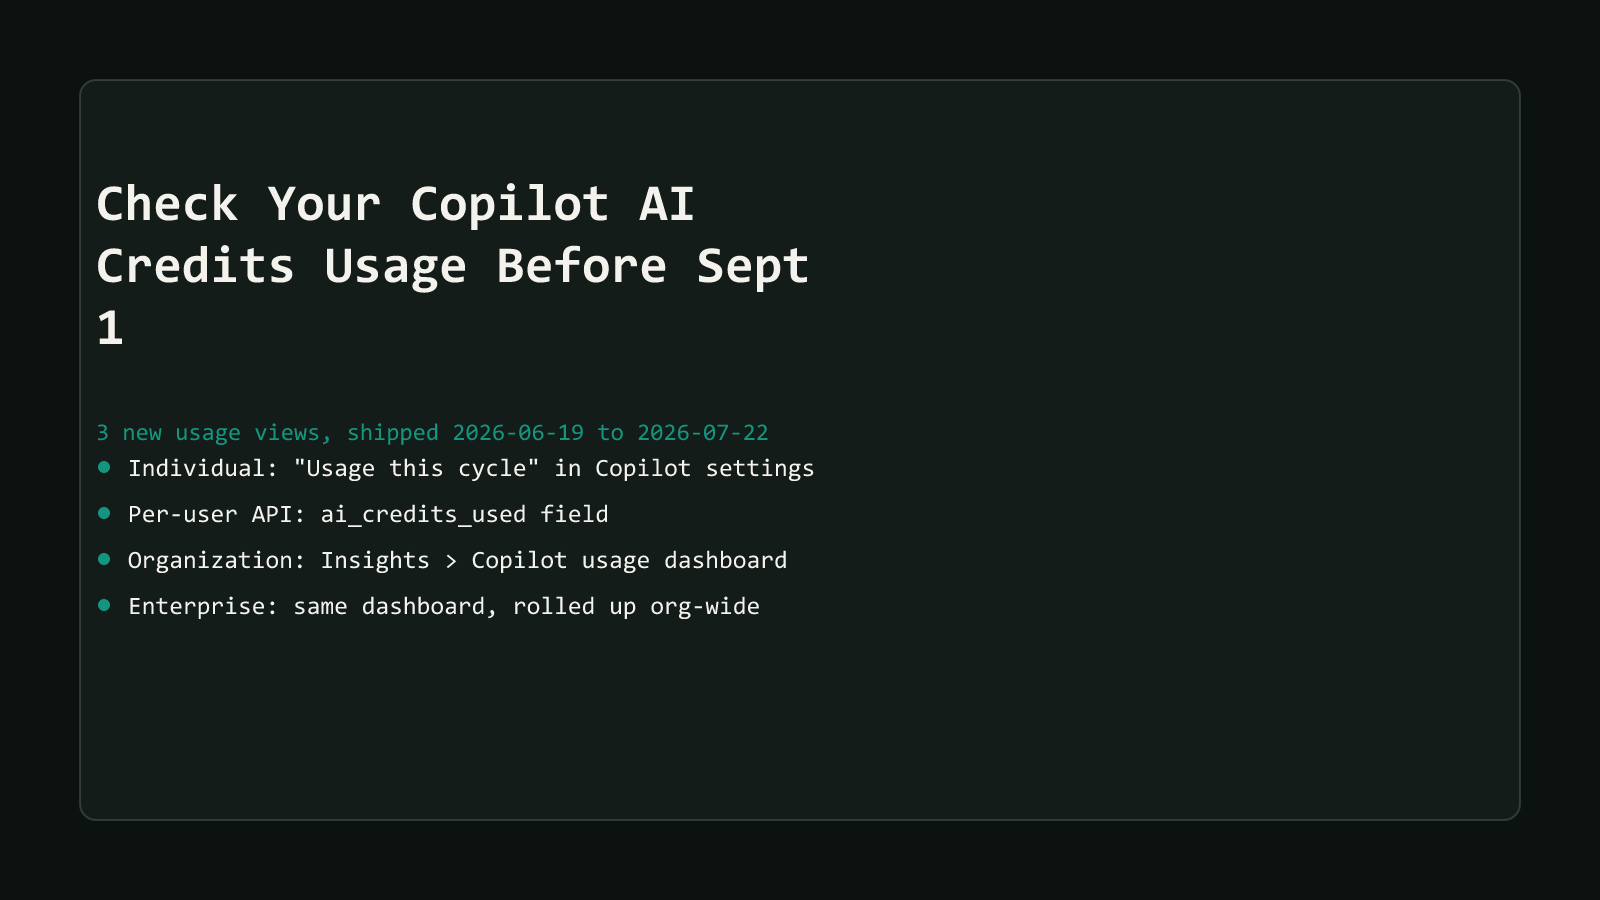
That changed fast, in three separate shipments over about five weeks. GitHub added a per-user ai_credits_used field to the Copilot usage metrics API on 2026-06-19, an individual per-cycle usage view in Copilot settings on 2026-07-20, and an org- and enterprise-level usage dashboard on 2026-07-22, according to GitHub’s own changelog. None of these are budget controls. They are visibility, the thing you need before a budget control is even worth configuring.
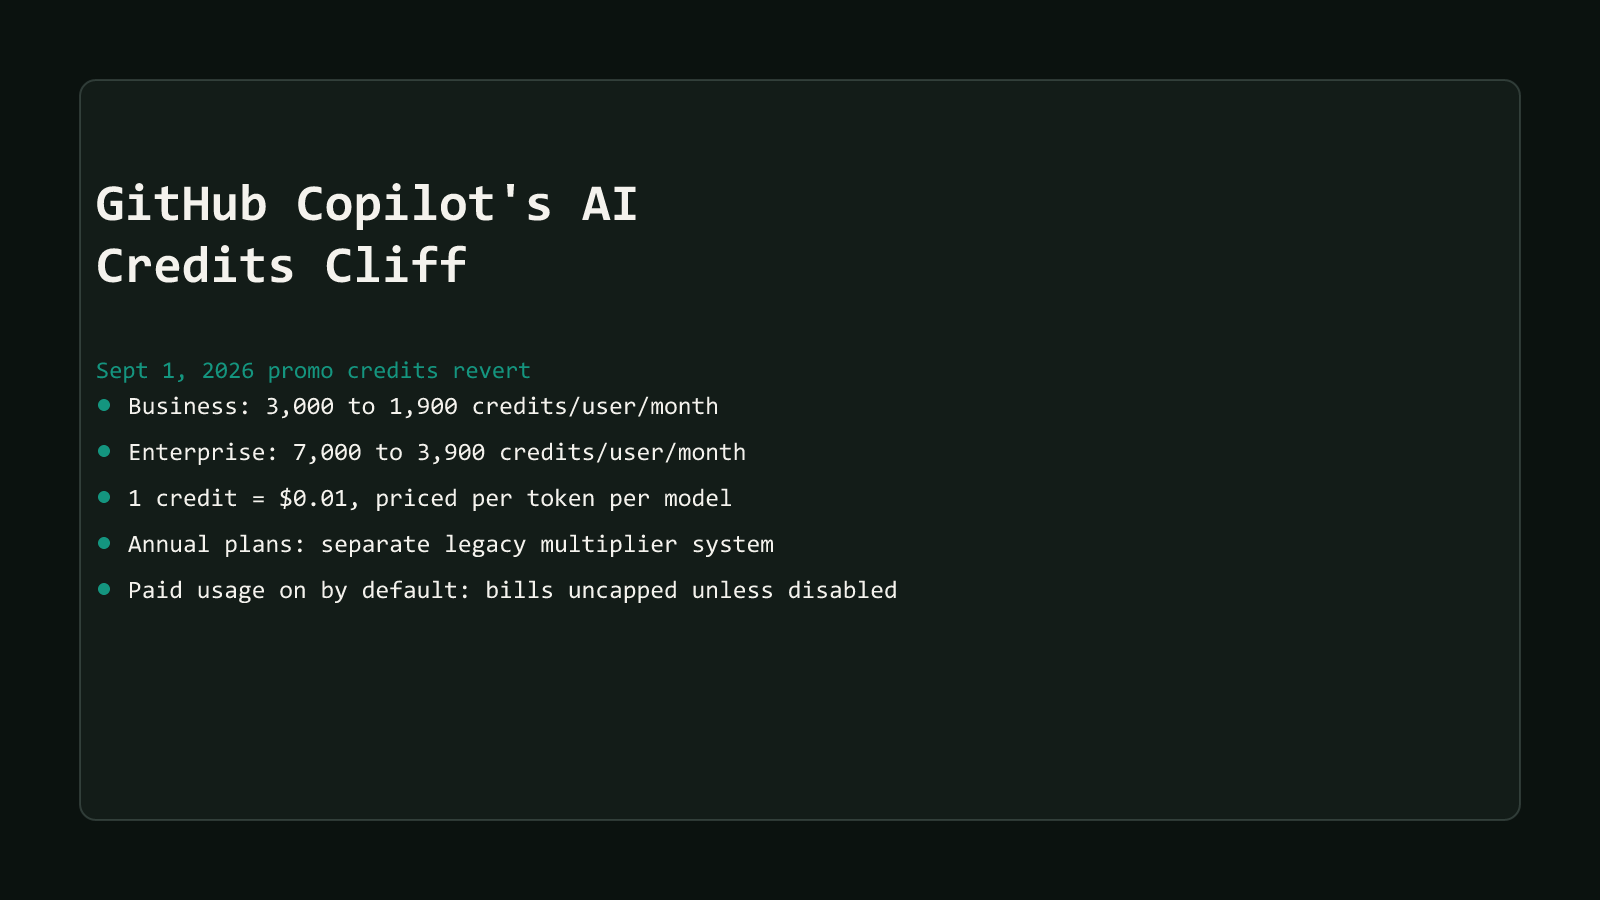
That distinction matters for this specific series. GitHub’s promotional AI Credits allowance (3,000 credits per Business seat, 7,000 per Enterprise seat) reverts to the standard allowance (1,900 and 3,900) on September 1, 2026, per GitHub’s own billing docs. The pillar hub on that cliff covers the reversion itself. This post covers the narrower, more immediate question: how do you actually check where you stand right now, at each of the three levels GitHub just made visible.
See your own number: Copilot settings, Usage
If you hold a Copilot Business or Copilot Enterprise seat, your own consumption is two clicks away. Click your profile picture in the upper-right corner of GitHub, select Copilot settings, and look under Usage. The section is labeled “Usage this cycle”, confirmed directly on GitHub’s own AI Credits monitoring docs, and it shows how many AI credits you have used in the current billing period.
This view needs no admin role. It is your own consumption, gated only by holding a Business or Enterprise seat, not by being an org owner or billing manager. If you have never opened it, that is the two-minute check to run before reading the rest of this post.
Copilot Individual uses a different page entirely
This “Usage this cycle” heading is specific to Business and Enterprise seats.
Copilot Individual subscribers see a separate AI usage page under
github.com/settings/billing instead, tied to that plan’s own pay-as-you-go
credits rather than the seat allowance this series covers.
Pull ai_credits_used straight from the API
The individual view answers “what did I use.” It does not answer “who on my team is closest to the cliff.” That is what the API field is for.
GitHub’s Copilot usage metrics API added an ai_credits_used field to its per-user reports on 2026-06-19. The per-user report family (*-users-1-day and *-users-28-day in GitHub’s own reference docs) returns one record per user, and ai_credits_used is defined there as the total AI credits a user consumed, one combined number across all of that user’s Copilot activity, without a separate breakdown by which model, feature, or surface generated it. The same reference page is explicit that this is a metrics signal for analyzing consumption, not a billed total, worth remembering before you treat it as an invoice line item.
Each per-user record carries more than the credit total. It also includes user_id, user_login, eight boolean used_* flags covering surfaces like chat, CLI, agent mode, and code review, and an ai_adoption_phase field. That last one is worth a closer look, since it is what powers the org-level dashboard covered next.
{
  "user_id": 4181923,
  "user_login": "octocat",
  "ai_credits_used": 742,
  "used_chat": true,
  "used_cli": false,
  "used_agent": true,
  "used_copilot_coding_agent": false,
  "used_copilot_code_review_active": false,
  "ai_adoption_phase": 1
}
The field names and their descriptions above are verified against GitHub’s own Copilot usage metrics reference. The specific values are illustrative, not a captured live response, since pulling a real one requires an org’s own API token. Per GitHub’s own docs, this endpoint is available to enterprise administrators and organization owners with access to Copilot usage metrics, not to an individual seat holder pulling their own record.
Structural Comparison Matrix
| Visibility level | Where to find it | What it shows | Access required | Shipped |
|---|---|---|---|---|
| Individual (self) | Copilot settings, Usage, “Usage this cycle” | Your own AI Credits used in the current billing cycle | Any Copilot Business or Enterprise seat holder, own account only | 2026-07-20 |
| Per-user (API) | Copilot usage metrics API, per-user reports | ai_credits_used total per user, plus used_* surface flags and ai_adoption_phase | Org owners and enterprise admins with API access | 2026-06-19 |
| Organization | Org’s Insights tab, Copilot usage | Adoption-phase cohorts and output metrics tied to credit spend, org-wide | Organization owner or billing manager | 2026-07-22 |
| Enterprise | Enterprise account’s Insights tab, Copilot usage | The same dashboard, rolled up across every organization in the enterprise | Enterprise owner, billing manager, or a custom role with View Enterprise Copilot Metrics | 2026-07-22 |
The dates are not decorative. All three views shipped inside a five-week window that ends five weeks before the September 1 allowance cut, which is a narrow amount of runway to notice a problem and act on it if nobody checks until the bill changes.
The dashboard ties credits to outcomes, not just spend
The 2026-07-22 dashboard is not a bigger version of the per-cycle number. It groups engaged users into four adoption phases, built from the same ai_adoption_phase field the API returns: Phase 0, no cohort, for users who did not meet the engagement bar for any phase; Phase 1, code first, for users who engaged with code completion or IDE agent mode; Phase 2, agent first, for users who touched exactly one of Copilot’s agent surfaces, its cloud agent, code review, or CLI; and Phase 3, multi-agent, for users who touched two or more of those same surfaces, or used the GitHub Copilot app, according to GitHub’s own changelog on the adoption-phase cohorts.
For each cohort, the dashboard surfaces average pull requests merged per month, median merge velocity, user counts, and lines of code produced, alongside a six-month trend and an adoption multiplier comparing passive users against engaged ones. That framing changes the conversation an org owner can have about credits. A team burning through its allowance in Phase 3 is a different problem than one burning through it in Phase 0, even if the raw ai_credits_used totals look identical.
Pull the NDJSON export if you need to slice the data further
The dashboard supports exporting the underlying data as NDJSON, which GitHub’s own docs suggest feeding back into Copilot Chat to answer questions like which users have high interaction counts but low code-acceptance rates. That is a faster way to find outliers than scrolling the dashboard’s own charts.
Check this before September 1, not after
Three checks, three different owners. If you hold a seat, open Copilot settings and look at “Usage this cycle” today, not the week the allowance drops. Org owners should pull the dashboard from the Insights tab and see which adoption phase their heaviest users sit in before deciding where to draw a budget line. Enterprise admins need the same check at the enterprise level, since a spike hiding in one org’s numbers can stay invisible until everything gets rolled up.
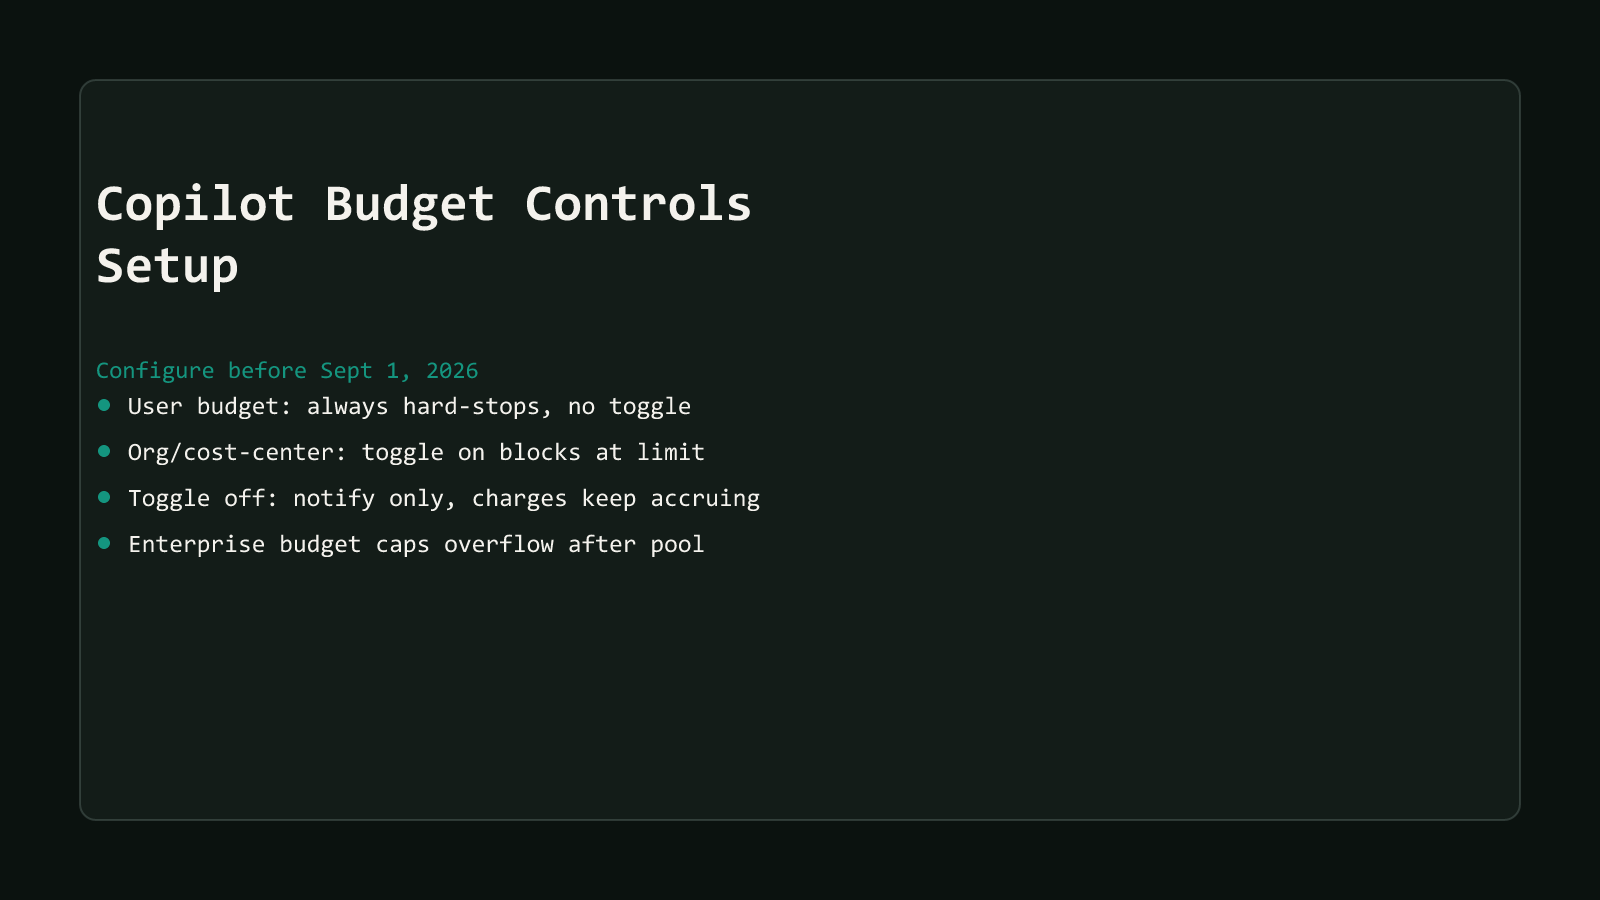
None of the three views in this post set a limit or send an alert. They only show you the number. Once you know where you actually stand, setting Copilot budget controls before the cliff is the next step, the one that turns this visibility into an actual guardrail instead of a number you have to remember to keep checking.
Browse more coverage like this in the AI Productivity archive, or start from GitHub Copilot’s AI Credits Promo Cliff hub for the reversion itself.